How Retailers Are Boosting Sales Using Footfall and Heatmap Analytics
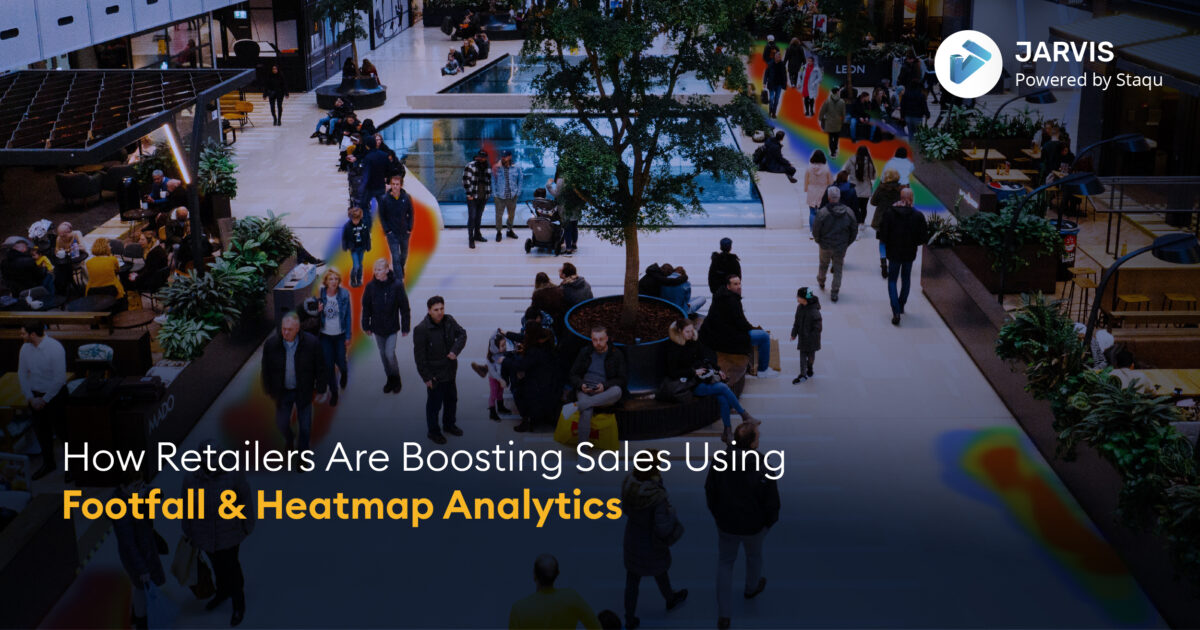
In this blog, you will find information on footfall and heatmap analysis and why the best retail businesses are moving towards utilizing video analytics.
Brick-and-mortar stores are distinguishing themselves in a digital world as customers are constantly looking for convenient and personalized shopping experiences. A Forbes study suggests that 53% of customers are willing to share their location in order to receive more relevant advertisements. This shows that people are eager to tell you where they are as long as they benefit from it. Retail business ideas are shifting towards a customer-centric approach to gain maximum returns. But, the first step retail businesses take to gain maximum insights from their stores is implementing a video analytics solution to acquire insightful data. Footfall and heatmap analytics are the principal instruments to acquire this data. You can track store performance through these features and understand sales, and customer metrics, improve inventory management and plan store layout based on that.
What is footfall analysis?
With footfall analysis, any retail business operator can assess how many customers/people travel through a specific location during the day. Retailers can use this information to keep tabs on their performance and spot potential revenue generators. By investing in real-time footfall counting analytics, retail stores can have access to precise, live data 24/7. It is a strategic sales move optimized with video analytics. Besides the benefits of optimized staff management, integrating better sales and marketing strategies to analyze the marketing reports based on the data, footfall counting also provides considerable operational savings and new commercial prospects.
Retailers can track the number of key performance indicators (KPIs), including conversion rate, visitor traffic count, staff scheduling, pedestrian foot traffic, dwell time, walk-in rate, shopper-to-staff ratio, and in-store visitor flow, by analyzing footfall counting information alongside other retail data. Integrating video analytics solutions such as Staqu’s in-house AI solution, JARVIS, on your existing store CCTVs placed in entrances and exits, you will easily receive the necessary data.
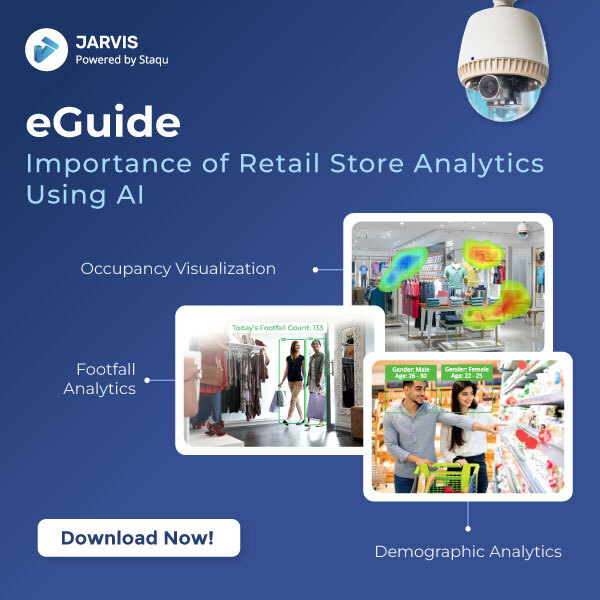
Download eguide
Also Read: Influencing retail industry trends using Retail Business Intelligence powered by AI
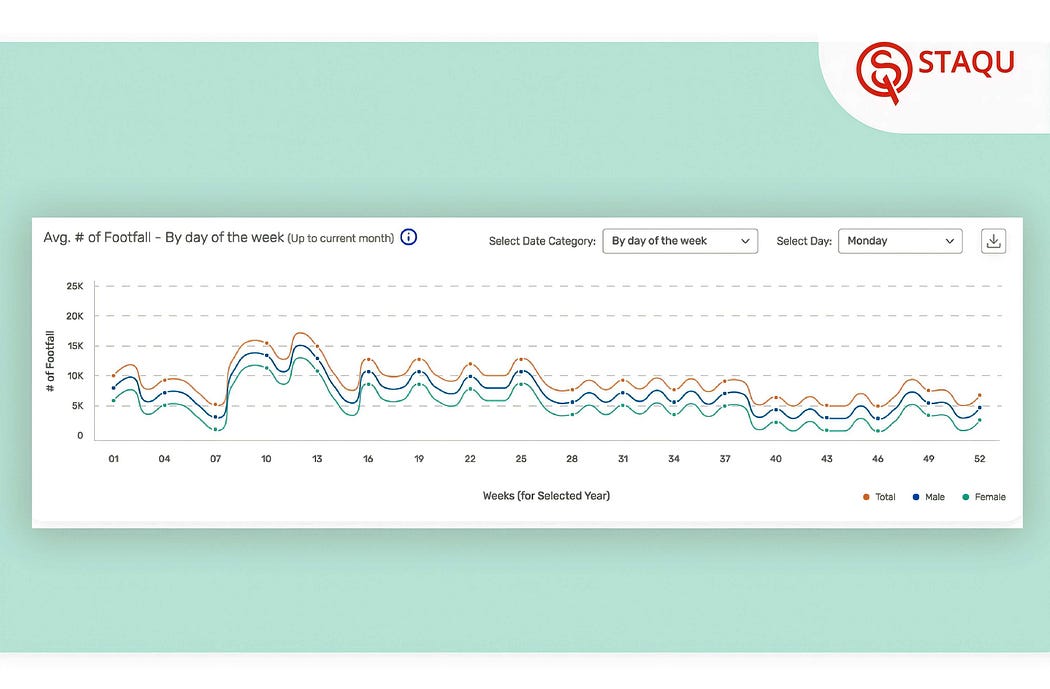
Staqu’s video analytics solution, JARVIS, is used by major retail companies. The JARVIS dashboard was explicitly designed with client convenience in mind. Numerous features in the product’s qualitative retail dashboard, broken down into the single store and aggregate levels, offer in-depth insights into your retail business. For example, you can check the daily footfall count of your retail stores, compare data from different weeks of the year, and other details. If you are looking to track your retail business’s performances on a certain day of the week across the year, say Monday of the year 2022, the JARVIS dashboard’s descriptive user interface will display the data of Monday of each week throughout the year in an informative graphical format. As a retail business owner, you can also trace the aggregate data of your stores across different regions using the video analytics solution JARVIS.
With JARVIS video analytics, you can assess the following features of footfall counting:
- Customer Flow: With over 99% accuracy, determine how many consumers enter and leave your shop locations.
- Peak Times and lean periods: Determine your retail store’s busiest times and low business periods of the year based on the days, weeks, and months.
- Benchmark Locations: With the insights obtained at the aggregate dashboard, compare and rank your various retail store locations.
- Conversion Rate: Integrate JARVIS with your POS systems to identify how traffic turns into customers.
- Inventory Planning: With footfall analytics, you can plan refined inventory management utilizing footfall and gender data across regions.
- Analyze Marketing Campaigns: With detailed data on footfall, retailers can use it to analyze the marketing outputs that are carried out and if they are effective enough to attract customers.
What is heatmap analysis?
A heat map is a data visualization that uses color and shading to illustrate the scope of the underlying data.
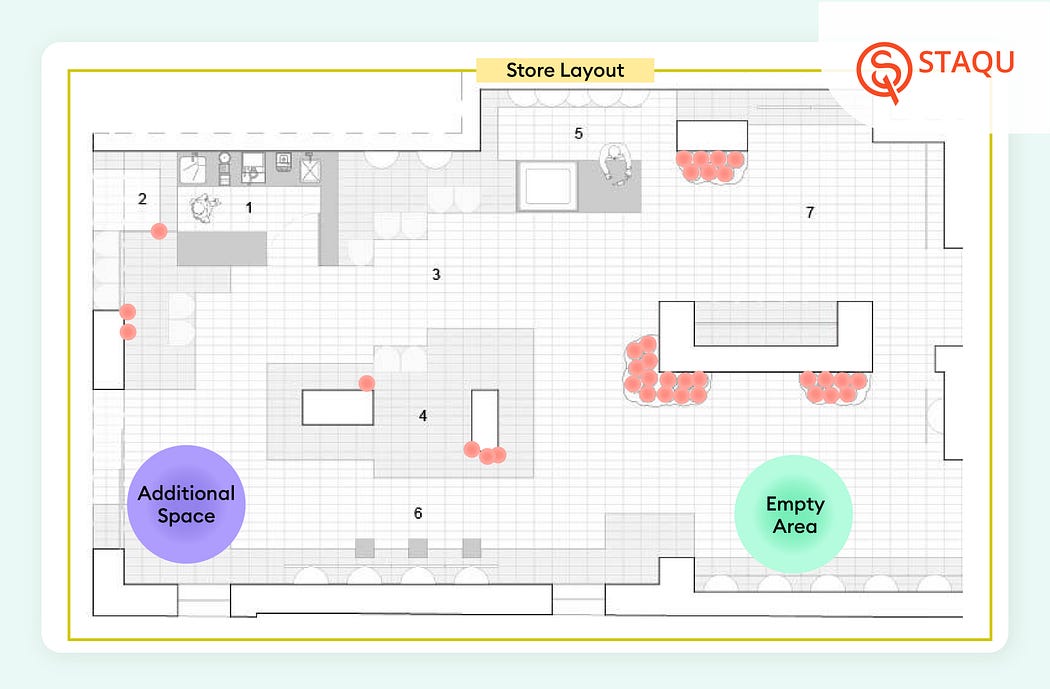
In the context of retail, we frequently discuss spatial heat maps. It implies that the floor plan of the actual business serves as the foundation of the visualization, on top of which colored data points of varying intensities are added to represent the areas with the highest occupancy. Retail business managers can quickly spot bottlenecks, view daily patterns, and observe which store’s occupancy is busiest and quietest by using a retail heat map.
Typically, cameras placed inside the retail store would be used to gather the feed. Using a plug-and-play video analytics solution, you may track activities and produce the data required to display the heat map on the analytics dashboard. On top of this, amalgamating an opex model will cut costs for your retail business. For instance, Staqu’s Retail Video Analytics technology, JARVIS, tracks customer behavior and generates thorough floor occupancy analytics and heat maps using the store’s existing security camera equipment. The occupancy details are comparable according to different sections of a store. You can get average occupancy insights of the previous day, various dates, and weeks through the JARVIS dashboard. Retail store managers can compare analytics on the occupancy of specific areas to find the busiest aisles and plan the store layout according to that information.
Book A Free Demo
Also Read: 5 Easy Steps to Elevate The Customer Experience at Your Retail Stores
With JARVIS video analytics, you can also assess the following features of heatmap analysis:
Drive in-store marketing strategies: Knowledge about the busiest areas of a retail business can influence your choice of store layout to maximize potential revenue as well as confirm the effectiveness of in-store marketing. Did customers stay longer in that area because of the new exhibit that caught their attention? You can learn more by using a heat map. Managers and store operators can also optimize staff planning using heat map analysis data. For instance, if a clothes retail store’s jeans department has more foot traffic than the other sections but has a smaller sales staff, store management can use the heatmap data to assign salespeople from the secondary traffic section to the jeans section.
Store layout planning: Your suppliers’ decisions regarding where to place their products in your retail store are another area where heat maps can offer helpful information to support your business. Retail store managers can use heat maps to back up any claims they might want to make about the areas of the retail business that see the most foot traffic.
Identify traffic hours: Heat maps can also show you the times of the day when your businesses are busiest and point out checkout bottlenecks that may cost you sales. You can take advantage of any time-specific patterns in your consumer data when organizing in-store marketing campaigns, analyzing employee-to-customer ratios, manage staff if and when required.
Final Thoughts
JARVIS analyzes in-store activities using the video feed from your existing security cameras. With this potent tool, you can delve deeper into what’s happening in your store. For instance, you may analyze all of the traffic to your store for a month, compare time periods, and dig down to specific times of the day.
Do you recognize the numerous advantages of footfall and heatmap analytics for your retail business? Are you unsure of where to begin? If so, take Staqu into account. Retailers can get real-time consumer insights from Staqu’s video analytics solution, JARVIS. JARVIS provides a thorough perspective of what is occurring in your store through footfall analytics, heatmap analytics, and other insights into on-site customer behavior. For additional information on the current state of your retail store, get in touch with us right away!
References: