6 Most Essential Retail Metrics To Measure The Success Of Your Retail Business
Let us explore the importance of retail metrics & how JARVIS can be utilized to analyze retail metrics…
#WednesdayWins are no longer wins for your retail store if your retail metrics don’t say so. Understanding and analyzing various metrics to keep an eye on your store’s performance is integral to developing a successful retail business.
Sales, inventory, and customer metrics are the three categories of retail metrics. These insights assist you in identifying potential gaps in your customer journey, the most popular products, strategies to boost sales, and more.
We’ll go into more detail about retail metrics in this article, including what they are, why they’re crucial to business performance, and the essential retail metrics you should monitor.
But first, what are KPIs in retail?
The key performance indicators, or KPIs, are the most crucial measures for your business. You must regularly examine these numbers to ascertain whether your company is headed in the right direction. What metrics should you consider? It depends. Since every retail firm is unique, some measures might be more important to you than others.
KPIs are typically used to assess whether your goals are being met. Key performance indicators are so-called because they enable you to assess your performance and choose the best course of action.
Nowadays, retailers have greater access to metrics than in the past. As is always the case with metrics and business, if we can measure it, we can improve it. Retailers have a number of options for enhancing their performance. KPIs can show you where you stand in terms of revenue, inventory movement, growth, customer satisfaction, and much more, depending on what you’re measuring.
Importance of monitoring retail metrics
According to studies, monitoring your metrics has a direct impact on how profitable your retail store is. You undoubtedly want to grow your company and improve store sales.
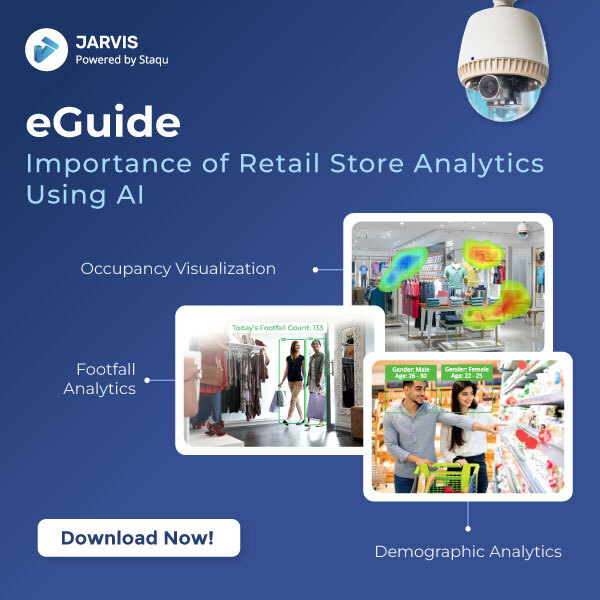
Download eguide
That’s just one of the many reasons you should monitor your KPIs. Let us explore some more:
Track performance
You can’t tell if your retail business is booming or experiencing a severe downturn if you don’t monitor your performance. The latter can sneak up on you and ultimately shut you down, whereas knowledge about the former can enhance your business processes.
Tracking performance enables you to identify areas where you need to make adjustments or advancements to boost sales and clientele. Additionally, it provides you with a thorough and transparent view of performance.

This is where a video analytics solution powered by AI, such as JARVIS, comes in handy. With an eagle-eye view through CCTV, the AI research behind JARVIS helps retail business owners and operators have centralized visibility and track the performances of multiple stores together. With JARVIS, you can also monitor store performance with easy-to-understand reports.
Also Read: 7 Ways Retail Video Analytics Can Transform Operations
Improve Forecasting
The success of a retail business depends on accurate sales forecasting. You need to precisely monitor and forecast inventory requirements at the SKU number level for each store to minimize inventory investments and maximize gross margin return on inventory (GMROI).
Analytics are needed to forecast at this level. If forecasting is done correctly, it can help you reduce expenses and increase revenue by
- Stocking enough inventory without going overboard
- Determining the best prices for SKUs
- Designating accurate merchandise and financial targets
Informed business decisions
Making business judgments without keeping track of KPIs is shortsighted. But you can make wise choices that boost sales if you have complete data and knowledge of your company’s past.
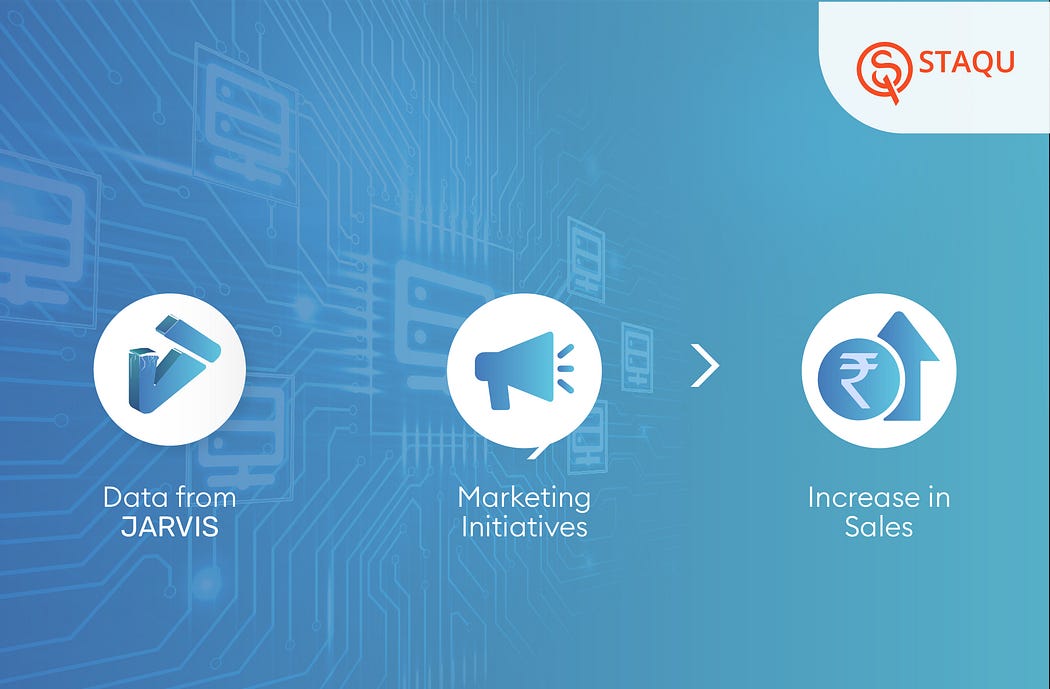
With JARVIS, you have access to historical data of your retail store, the date range can be personalized according to your need, and you can compare analytics data from the previous week, month, or year to make informed decisions pertaining to sales and marketing.
Book A Free Demo
Retail metrics and KPIs
The sales volume is the most typical retail growth metric. You are growing if you are selling more. Growth, though, includes more than just an increase in revenue; it also involves streamlining your operations. Enhancing processes can help you contact more consumers successfully, boost employee morale, and increase or reduce your inventory cost-effectively. Ultimately, those will result in higher sales and improved business expansion. The most popular retail KPIs used to gauge success are listed below.
Sales Metrics
Sales per square foot
This metric relates to how many sales you make per square foot of retail space in your business. Retail sales per square foot is an excellent measure of store productivity and can show whether your shop utilizes its space and furnishings effectively. You can use this metric when organizing your store’s layout and inventory.
Your store will determine the best sales and retail productivity strategies. However, the following are some general pointers for raising sales per square foot:
- Organize your store better.
- Have a successful product lineup.
- Improve your offers or prices.
- Encourage customers to stay at your store longer.
To enhance retail sales per square foot, data from Staqu’s video analytics solution, JARVIS, can be utilized, such as heat map data. If your store sells clothing, for instance, you might have sections where you sell shirts, tops, suits, fabrics, and more. Now you may also identify which subsection needs to be highlighted more than the other to increase sales by studying the occupancy data from a subsection and comparing that with the sales data. You can design the store layout to put greater emphasis on the shirt area if it sells more merchandise.
Also Read: How Retailers Are Boosting Sales Using Footfall and Heatmap Analytics
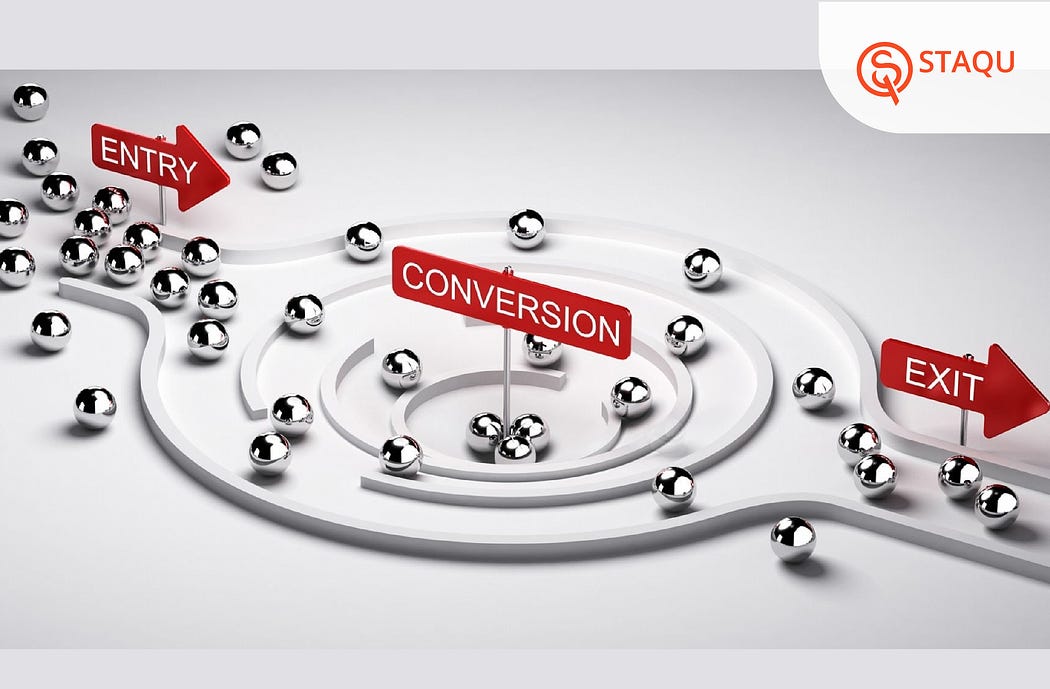
Conversion rate
The conversion rate is the ratio of customers who visited the store to those who actually made a purchase. Your conversion rate demonstrates how successfully you convert visitors into customers. Driving traffic to your store is wonderful, but if your visitors don’t convert, traffic won’t have much of an impact on your bottom line.
It is vital to identify the factors that affect a visitor’s buying choice and to take action to make sure that all of their concerns are addressed. According to studies, only about 30% of people who enter a retail business ultimately leave with a purchase, leaving at least 70% of visitors open to persuasion.
Basically, if you want to know the conversion rate of one store from your chain of stores, you can gather the total footfall count of that particular store from the JARVIS dashboard and compare it with the store’s total sales. With the queue management feature, you can minimize customer churn rates by avoiding long queues and employing more billing counters, ultimately converting visitors waiting to abandon a queue to happy customers leaving a store.
Also Read: Leveraging In-Store Video Analytics Insights in Retail to Improve Customer Experience
Customer Metrics
Footfall Traffic
Every retailer should, without a doubt, track a basic metric called “visitor count.” Footfalls will let you know what’s working and what needs to be improved, whether it’s the holiday shopping season, a new store location, a new display window design, or that loyalty program you just started. Once you are aware of your foot traffic, it’s critical to monitor whether these are bringing in money for your company.
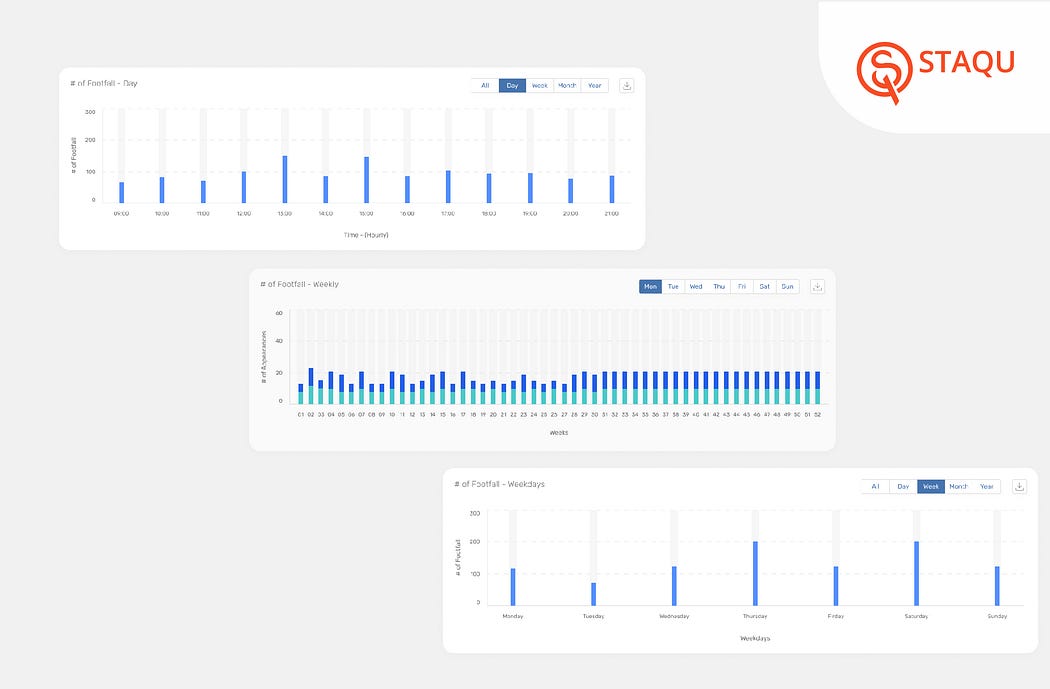
With JARVIS’ trend analysis feature, you get a comprehensive analysis of the footfall data of your store that ultimately helps you drive your marketing campaigns accordingly. If the trend analysis shows that for a particular store, Tuesdays see the highest number of footfall converting to sales, then the #WednesdayWins marketing initiative won’t make much of a difference in that store. It is common knowledge that offers attract repeat customers to shop more. Marketing managers can work with the data from JARVIS to keep promotional activities on Tuesdays rather than Wednesdays if the metrics say so.
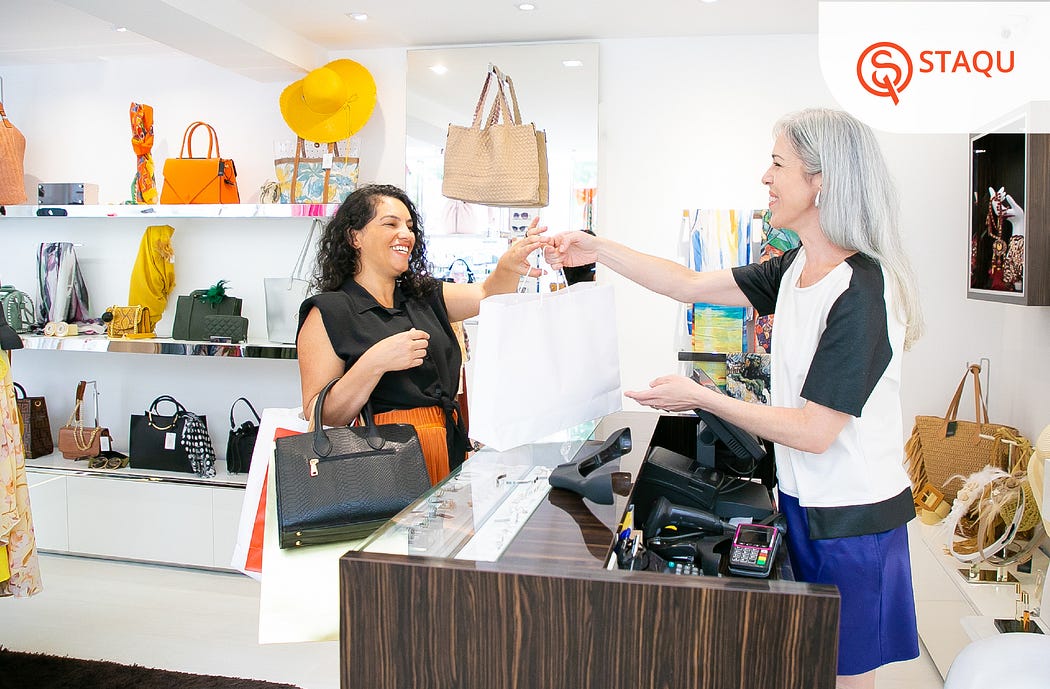
Customer Retention
It only makes sense that you determine whether or not you are retaining the customers you have worked so hard to get. How many repeat consumers visit your store is shown by your customer retention rate. Product, customer satisfaction, and brand loyalty may all be measured with this metric. How successfully you handle your customer interactions will determine whether or not consumers return.
Good customer service is key to customer retention. In most retail stores, queue abandonment is one of the major reasons why there is a sales drip. Staqu’s research team developed a unique feature called “Average Billing Time” that shows the average duration taken by customers to make a purchase. This feature is a significant part of JARVIS because data from this feature can be used for queue management. If a customer’s waiting time is longer in a queue, then new billing counters need to be added for better functionality.
Inventory Metrics
Gross margins return on investment (GMROI)
Although it has a name with the standard gross profit statistic, this one’s objective is a little different. GMROI calculates your return on investment (ROI) based on the amount you invest in product stock. In actuality, this implies that this KPI can tell you how much money you recover for each dollar you invest in your inventory.
For a few reasons, it is crucial to monitor the return on investment. Compared to just sales or profit margins, it provides greater detail. Instead of tracking the entire inventory, GMROI often tracks particular goods or categories. Because of its specificity, you can learn what should be kept in your stock and what shouldn’t, as well as what you should consider investing in more. Your retail business does better overall if you make more on each profit margin. Growth occurs when you identify investments that provide a high return on your initial investment.
Shrinkage
Inventory loss that isn’t due to real sales is referred to as shrinkage. Employee theft, shoplifting, procedural failures, and supplier fraud are common causes of shrinkage. Losing products or money to things like theft or administrative mistakes is the last thing you want to happen. Monitoring shrinkage helps you be on guard and makes sure nothing unethical is going on in your company.
The use of video analytics solutions has a number of advantages; loss prevention is one of them and a major one. The billing counter monitoring feature of JARVIS is used extensively by major retailers for loss prevention. Although this feature has several other uses, retail business owners particularly monitor operational processes and keep a check on inventory sales through it.
Final Thoughts
These KPIs should be able to get your retail business off to a good start and help you monitor its expansion. Find out more about KPIs for successful marketing campaigns and sales teams if you need assistance attracting customers or converting them into sales. Are you ready to start analyzing your store’s data to set the right goals for your business? Learn how data and analytics is transforming the retail sector. Get a free demo of JARVIS Video Analytics Solution!